11 states with growing radon risk and what it means for property values
Radon is not the kind of threat that makes the evening news. It has no smell, no color, and no dramatic video. But, you need to be aware of it.
Yet a 2025 study in the Proceedings of the National Academy of Sciences used data from more than 6 million U.S. home tests and found that about 26.8 percent of Americans live above the Environmental Protection Agency’s action level for radon.
The EPA already blames radon for about 21,000 lung‑cancer deaths per year and ranks it as the number one cause of lung cancer in nonsmokers, which means this silent gas quietly sits near the top of America’s risk charts.
More than 70 percent of Americans are unfamiliar or only vaguely familiar with radon, so millions of people living in those hotspots have no idea the air in their living rooms is part of a growing public‑health warning.
1. Alaska
Alaska is number one on the 2026 World Population Review list, with an average indoor radon level of 10.7 picocuries per liter, more than double the EPA’s “fix it” line. Because the state is so cold, many homes are built very tightly to keep in heat, which also traps any radon that sneaks in from the ground.
The 2025 PNAS mapping study places large parts of Alaska in its highest radon category, sometimes called “Zone 5,” meaning many people there are breathing air that is not as harmless as the snow outside suggests. Yet many Alaskans have never tested their homes, which makes the state a strange mix of extreme risk and low awareness.
2. South Dakota: Ground zero for radon
South Dakota looks calm on a map, but the high‑detail radon charts tell another story. The PNAS team found that it has the highest population‑weighted radon level in the country, around 128 becquerels per cubic meter, which translates to roughly 3 to 4 picocuries in many homes. In some counties, more than half of the tested houses break the EPA’s 4.0 line, turning normal‑looking living rooms into long‑term risk zones.
Researchers call parts of South Dakota “Zone 5” territory, in the same top danger band as the worst areas of Pennsylvania and Ohio. State officials now warn that the default indoor air in some towns is simply not safe enough, especially for kids who spend hours in basements or downstairs bedrooms.
3. Pennsylvania: Rust Belt, radon belt
Pennsylvania’s past is coal and steel; its present includes radon. World Population Review reports the state’s average at about 8.6 picocuries per liter, which is very high compared with the national indoor average of 1.3 picocuries per liter. The EPA’s radon zone map marks large areas as top‑risk, partly because older homes with basements can allow gas to build up.
The PNAS mapping work draws a bright target over eastern Pennsylvania, including suburbs around Philadelphia and the Lehigh Valley, where huge numbers of homes sit above 4.0 picocuries. In real life, that means a regular split‑level or farmhouse can expose nonsmokers to enough radon over decades to noticeably raise their lung‑cancer odds.
4. Ohio: The hot spot in the heartland
Ohio is not famous for scary pollution, yet the PNAS study names one small city there as the worst radon hot spot in the country. Newark, in ZIP code 43055, shows a predicted average of 246 becquerels per cubic meter, far above the danger line. Statewide, Ohio’s average is about 7.8 picocuries per liter, which means the “normal” home is several times above the U.S. mean.
That level of risk is changing how people buy houses. In many Ohio counties, a big share of homes tested already come in above 4.0 picocuries, which makes radon testing feel less like an optional add‑on and more like checking the brakes on a used car. The invisible gas is now one of the most important things on an inspection list, even if many owners still have trouble pronouncing “picocurie.”
5. Washington: Evergreen state, radioactive basements
Washington sells itself as forests, coffee, and misty air, but the radon numbers are not so dreamy. Its average indoor level sits around 7.5 picocuries per liter in recent rankings, which lands it in the same rough zone as Ohio. The catch is that western coastal areas are lower, while eastern and central counties behind the Cascades have much higher readings in basements and ground‑floor rooms.
The PNAS maps show some of those inland areas in clearly elevated radon bands, even as the Seattle side of the state looks calmer. That split has a cultural side, too: health advocates in Washington talk about indoor air in the same conversations as wildfire smoke and mold, so radon has become part of a bigger “home health” worry, especially for parents and renters.
6. Kentucky: The invisible mine underfoot
Kentucky’s hills hide old coal mines and caves, but they also sit on rocks that naturally give off radon. The state’s average indoor level is about 7.4 picocuries per liter, and many counties are labeled high risk on EPA maps. Homes built into slopes with basements or crawl spaces give the gas easy paths indoors through tiny cracks and joints.
Researchers at the University of Kentucky have pointed out that the state’s radon problem has not been matched by loud, clear warnings. In a place where smoking rates are already high, that matters, because the EPA says radon plus cigarettes work together to raise lung‑cancer risk far more than either one alone. It is a harsh team‑up: tobacco above ground, uranium below.
7. Montana: Big sky, small warning label
Montana advertises big sky and clean rivers, yet its average radon level of about 7.4 picocuries per liter undercuts the “pure air” image. National radon risk indexes and state data show that in some rural counties, most tested homes are above the EPA’s 4.0 line, turning barns, ranch houses, and cozy cabins into surprise exposure spots.
The PNAS team folds parts of Montana into the same high‑risk band that stretches through the upper Midwest and mountain West. For people who moved there chasing outdoor wellness, it is jarring to hear that the air two feet above their basement floor may be the most dangerous air they breathe all day. Healthy hikes, risky Netflix nights.
8. Idaho: Hot readings, cold awareness
Idaho lands just behind Montana on the 2026 rankings, with an average of 7.3 picocuries per liter and a long list of homes above the EPA danger line, especially in the panhandle and mountain regions. State sources say that in some areas, around four in ten tested houses beat 4.0 picocuries, which is not exactly the tourism slogan anyone asked for.
Yet many residents barely know what radon is. A 2024 awareness report by Airthings found that over 70 percent of Americans were unfamiliar or only vaguely familiar with radon, even as testing and mitigation gear became more popular. Idaho’s own behavioral surveys align with that finding, suggesting many families are living with high readings and low understanding at the same time.
9. Colorado: Mountain air with a catch
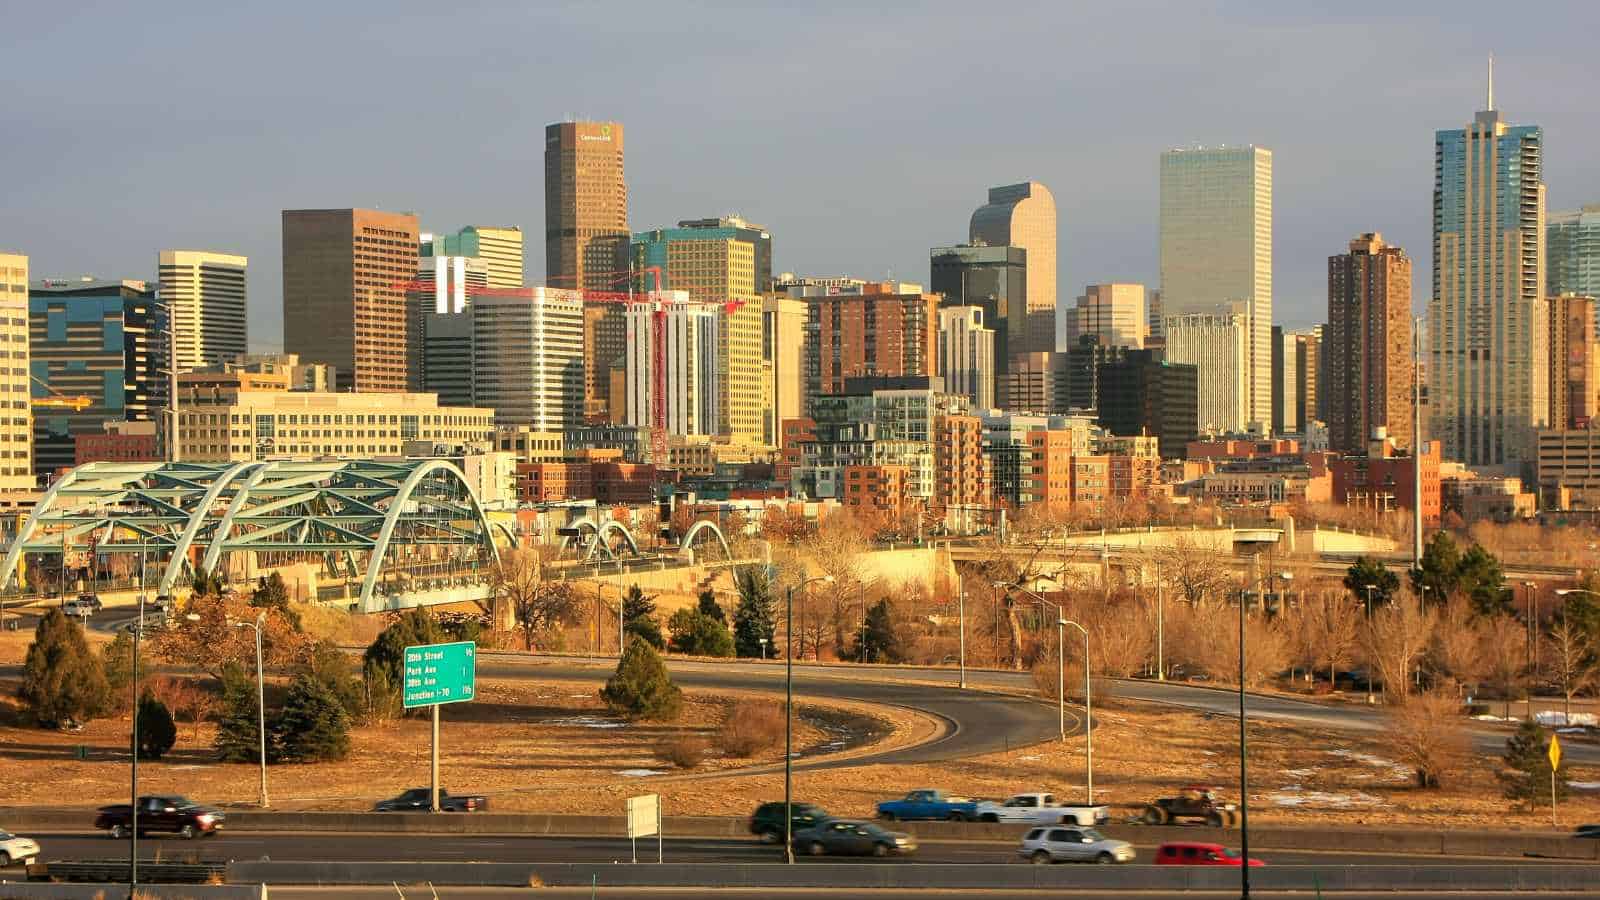
Colorado has built a brand around fresh, high altitude air, but its average indoor radon level of 6.8 picocuries per liter tells a different story. The state health department notes that every single county has homes over the EPA’s action level, from Denver and Boulder to smaller mountain communities like those in La Plata County, which national radon risk indexes rank among the worst.
The PNAS maps back this up by putting pieces of Colorado in the same big high‑risk band that runs through other interior western states. For many residents, it is a strange twist: you can jog at altitude, drink green smoothies, and still be taking in a slow drip of radioactive gas every night in your basement bedroom. Wellness, but with a hidden asterisk.
10. Iowa: Bull’s‑eye of the Midwest
Iowa’s statewide average of 6.1 picocuries per liter might not sound as dramatic as Alaska’s, but the key is how many homes sit above the EPA danger level. The Iowa Cancer Consortium reports that a huge share of houses test at or above 4.0 picocuries, thanks to glacial soils, uranium‑bearing rock, and a love of basements where families hang out.
The PNAS study puts much of Iowa in a continuous high‑risk zone that stretches across Nebraska and into the Dakotas, calling it one of the country’s most serious radon corridors. Over time, that kind of exposure can raise lung‑cancer risk even for people whose wildest habit is extra ranch on their pizza, which is not the health warning most Midwesterners grew up with.
11. North Dakota: High numbers, low testing
North Dakota does not always appear near the top in simple average charts, but once you look at detailed maps and testing data, it stands out. The PNAS team marks big areas of the state in its highest radon category, and state and industry sources say that in some communities, more than half of the tested homes exceed 4.0 picocuries.
The trouble is that many homes have never been tested, so those high percentages may only reflect the worried few who asked for a test kit. As free testing programs expand and health campaigns try to get the word out, North Dakota is becoming a real‑world example of how a slow, invisible problem can quietly grow for years before most people even know it is there.
So what should people actually do?
The PNAS study found that about 26.8 percent of Americans live in homes above the EPA’s action level, but the researchers stressed an important point: fixing radon is possible, not science fiction. The EPA points to “active soil depressurization” systems, which are basically pipes and fans that pull gas from under the house and vent it outside, as a way to cut indoor radon by around 80 percent or more.
The bigger challenge is awareness. Airthings’ 2024 survey shows that most people still know little about radon, even though test kits are cheap and can be used over the weekend. If there is one clear takeaway from all the maps and charts, it is this: the scariest thing about radon is not just the gas itself, but how easy it is to ignore it until someone finally checks.
You may also want to read:
- 15 Silent Threats That may Be Inside Your House
- 10 baby boomer real estate rules that will bankrupt first-time buyers today
- If a real estate agent knows a house is a terrible investment right now, they’ll likely say these 10 phrases