12 reasons America should create real possibilities for inclusion in urban design
The most honest thing an American city can do is publish its zoning map alongside its demographic map. For decades, urban planning in the United States has operated as a mechanism for preserving advantage rather than distributing access, producing built environments that work efficiently for some populations and function as obstacle courses for everyone else.
The Urban Institute found that cities with the most restrictive zoning regulations have higher levels of income segregation than cities with more permissive land-use policies, a correlation consistent enough across regions that researchers described it as structural rather than incidental.
Vienna figured this out. Medellín figured this out. Houston, of all places, figured part of it out. The question is no longer whether inclusive urban design is possible. It is why American cities keep choosing not to build it.
Inaccessible Streets Are a Civil Rights Failure in Plain Sight
61 million Americans live with a disability, roughly 28.7% of the adult population, navigating cities that were never designed with them in mind. The U.S. Access Board has identified over 14,000 miles of federal right-of-way pathways that still fail basic accessibility standards.
The DOJ Civil Rights Division has filed and settled ADA sidewalk compliance actions against more than a dozen American cities. Sacramento’s Barden v. City of Sacramento settlement in 2004 required the city to fund decades of sidewalk retrofitting under court supervision, for infrastructure that federal law had already mandated in 1990. For a law signed in 1990, a 30-year remediation window is its own verdict.
The cost argument against fixing this collapses against a single figure: working-age adults with disabilities hold $490 billion in annual disposable income, per a 2018 American Institutes for Research report. Inaccessible urban design doesn’t protect municipal budgets; it taxes an economy that’s already there.
Zoning Laws Were Engineered to Exclude

The historical record on why American zoning evolved this way is unambiguous: exclusionary zoning was a legal successor to racial covenants after the Supreme Court ruled racial deed restrictions unconstitutional in 1948. Shelley v. Kraemer didn’t end residential segregation; it redirected it through land-use law.
The legacy is measurable: a 2020 study published in the journal Housing Policy Debate found that neighborhoods redlined in the 1930s remain 74% more likely to be lower-income and 64% more likely to be majority-minority today.
Urban design that ignores this history builds on a rigged foundation. Inclusionary urban planning must confront zoning reform as its first structural intervention, not its most radical one. Adding bike lanes to a neighborhood that’s been economically strangled by 80 years of exclusionary land-use policies is like redecorating a wound.
Green Space in America Is Racially Rationed

A 2020 analysis by The Trust for Public Land found that neighborhoods of color have access to 44% less park space per person than white neighborhoods. This disparity is documented across hundreds of American cities and consistent enough across geographies that researchers stopped calling it a pattern and started calling it a system. Low-income neighborhoods of color received parks at a fraction of the acreage available to affluent white neighborhoods: a gap that urban planners have documented for decades without closing.
The American Heart Association published data in 2019 showing that proximity to green space correlates with reduced cardiovascular disease risk, reduced type 2 diabetes incidence, and measurable reductions in cortisol levels. The neighborhoods with the least green space are experiencing the highest rates of exactly these conditions. The South Side of Chicago has a life expectancy 30 years shorter than its northern lakefront neighborhoods.
Meanwhile, the High Line in Manhattan, an elevated park built on a former freight rail line, increased property values in surrounding areas and contributed to the displacement of lower-income residents from adjacent neighborhoods within a decade of its 2009 opening.
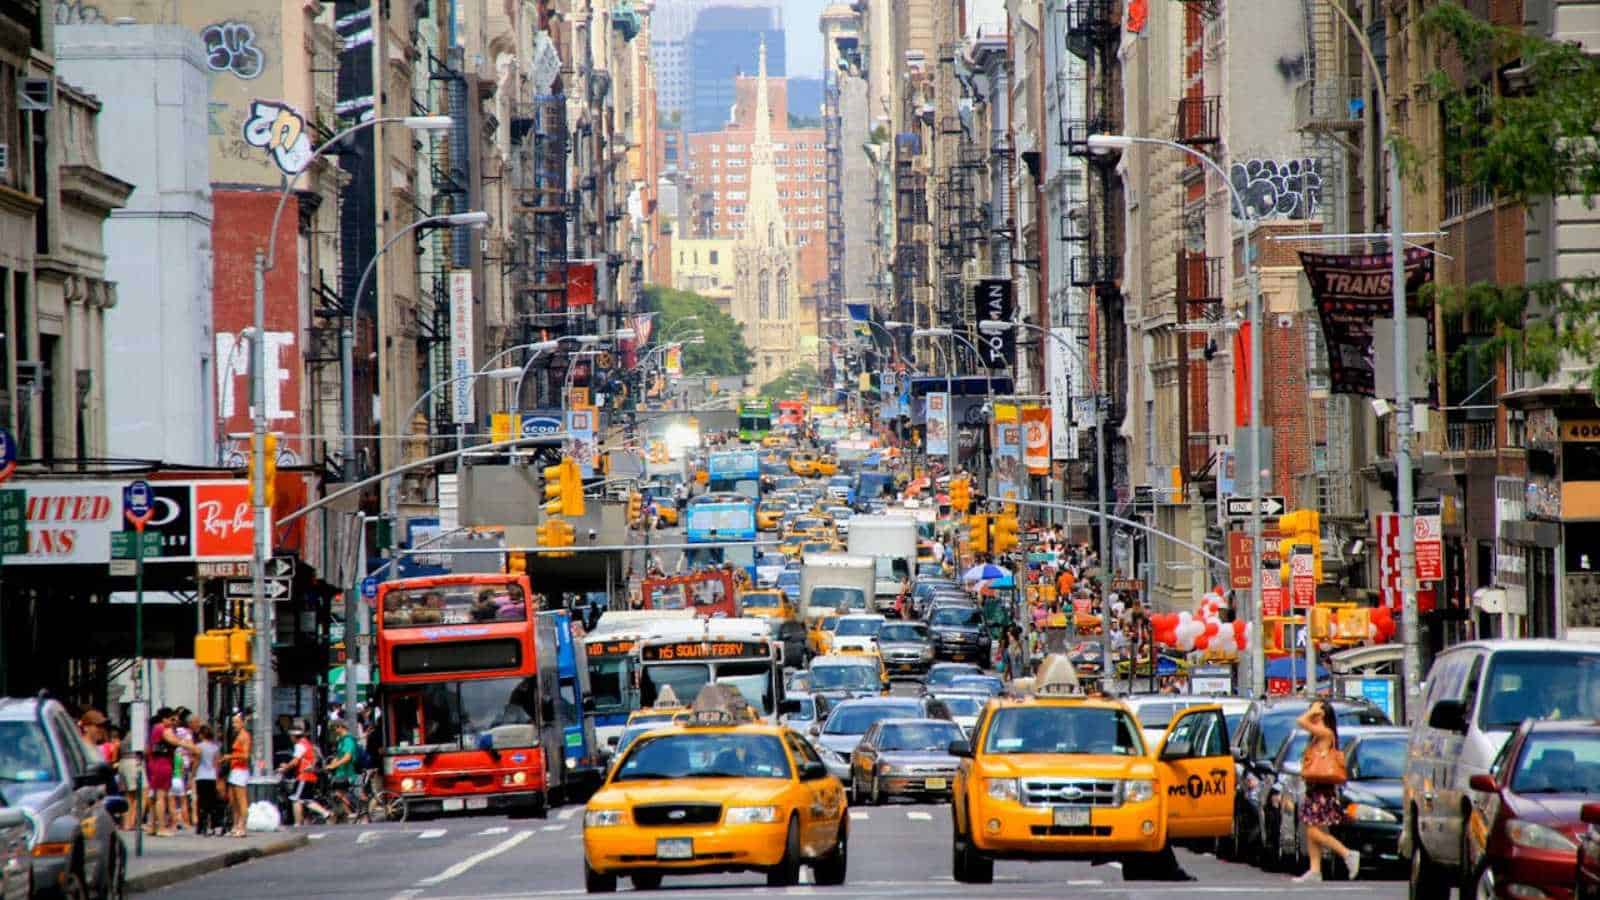
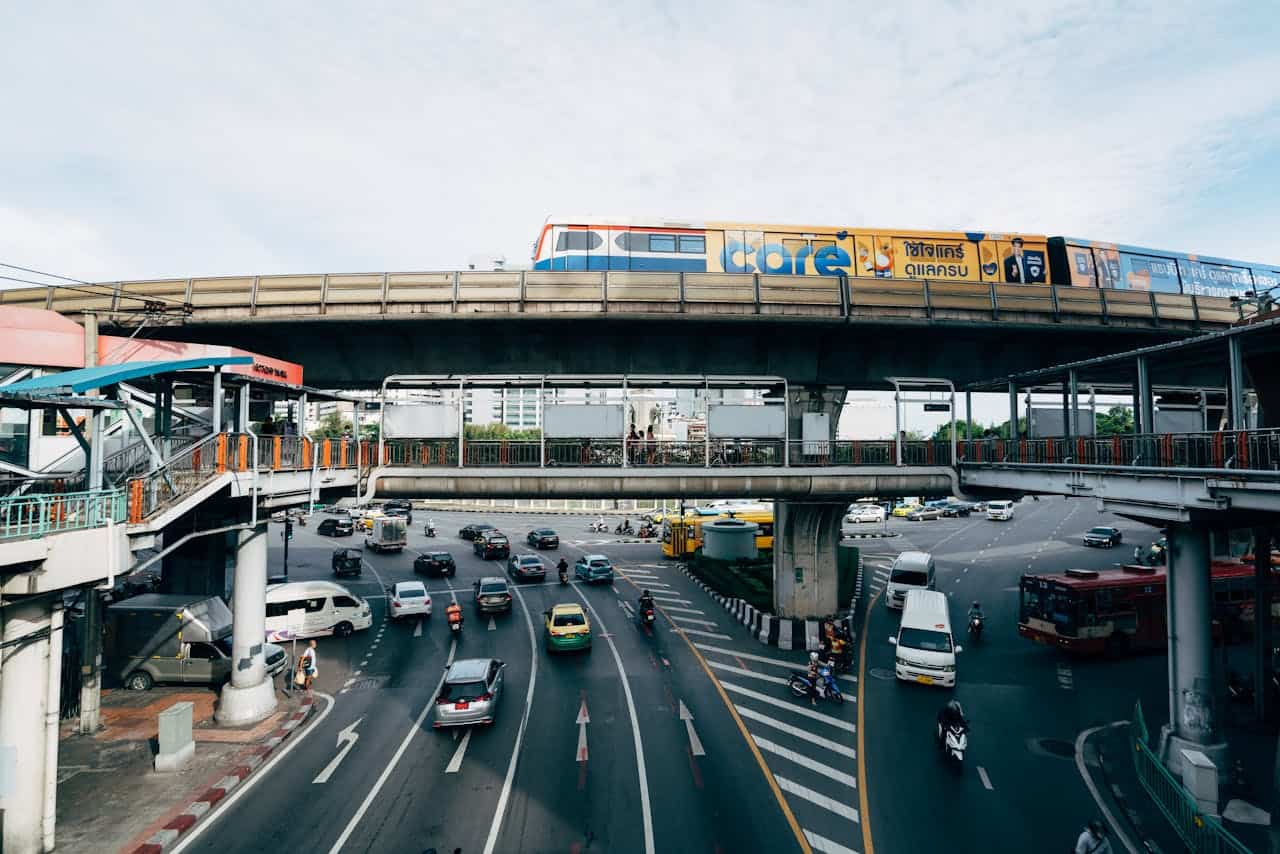
Transit Deserts Are Where Economic Mobility Goes to Die
The Brookings Institution published an analysis in 2020 showing that low-income workers in America’s 100 largest metropolitan areas can reach only 30% of jobs in their metropolitan region via public transit within 90 minutes.
It means that three-quarters of available employment is structurally inaccessible to someone without a car, and that car ownership in low-income households costs between $6,000 and $10,000 annually in insurance, maintenance, financing, and fuel costs.
The Washington Metro system, opened in 1976 and designed by a planning team that included no community input from the neighborhoods it cut through, spent $9.8 billion in federal and local funds and routed seven of its twelve original lines through affluent suburban corridors. Anacostia, a majority-Black neighborhood less than two miles from Capitol Hill, got one station.
Some transit agencies have begun reckoning with this. Los Angeles Metro published an Equity Platform in 2021 and rerouted a segment of its J Line extension following community pressure from Eastside neighborhoods. Ridership on newly equitable routes increased by 18% within the first 12 months.
Whose Nervous System Did Planners Have in Mind?

One in 36 American children is diagnosed with autism spectrum disorder. Millions of adults carry sensory processing disorders, anxiety, or post-traumatic stress. Public spaces built around noise above 85 decibels, high-flicker fluorescent lighting, and wall-to-wall crowd density aren’t uncomfortable for these populations. They are inaccessible.
The Sensory Trust, a UK-based design organization whose principles have been adopted by planning departments in Edinburgh, Melbourne, and select American cities, including Austin and Denver, outlines a framework for sensory-inclusive design. Quieter material surfaces, predictable spatial sequences, low-stimulation wayfinding zones, and sensory gardens or decompression spaces embedded within larger parks and transit hubs.
The pushback against sensory-inclusive design tends to be budgetary, though the math rarely holds. The Denver Union Station redesign, completed in 2014, incorporated sensory design principles at an incremental cost. Its retail and food hall revenues exceeded projections, driven in part by its appeal to a broader cross-section of commuters and visitors, including families with children who would otherwise avoid high-stimulation environments.
Affordable Housing Alone Cannot Produce Inclusive Neighborhoods
The Section 8 Housing Choice Voucher program, the federal government’s primary rental assistance mechanism, served approximately 2.3 million households in 2023. Children from low-income families who moved to high-opportunity neighborhoods before age 13 earn 31% more as adults, are more likely to attend college, and are less likely to be single parents than those who stayed in lower-opportunity areas.
Yet the majority of Housing Choice Vouchers are redeemed in low-opportunity neighborhoods. Inclusionary zoning, which mandates affordable-unit set-asides within market-rate developments, exists in over 700 American jurisdictions, but compliance is inconsistent, exemptions are common, and the income bands targeted often exclude the lowest-income households.
Montgomery County, Maryland’s moderately priced dwelling unit program, which has run since 1974 and is often cited as the national model, has produced roughly 17,000 affordable units over five decades in one of the country’s most expensive suburban counties. That’s meaningful. It’s also 50 years since housing that most families can’t access without a lottery was built.
Language Access in Public Space Is Not a Courtesy

Over 67 million Americans speak a language other than English at home. Of those, approximately 25 million are considered limited English proficient, a classification meaning they cannot perform everyday tasks, including navigating public transportation, reading posted emergency procedures, or understanding construction signage, in English alone.
The Department of Transportation’s Language Access Plans, required under Title VI of the Civil Rights Act for transit agencies receiving federal funding, are supposed to ensure materials are available in any language spoken by more than 5% of the service area’s population.
Street-level signage, wayfinding, and emergency alert systems in most American cities exist almost exclusively in English, often without even universally understood iconography as backup. During Hurricane Harvey in 2017, the Houston Office of Emergency Management’s evacuation alerts were delayed relative to English-language alerts.
The alternative model already exists in several American cities. Chicago’s Transit Authority introduced multilingual digital signage, covering Spanish, Polish, Mandarin, and Tagalog, the four most spoken non-English languages in its service corridor.
The Built Environment Has No Plan for Old Age

By 2030, one in five Americans will be 65 or older: the first time in the nation’s history that the elderly population will outnumber children under 18. The AARP released a 2021 survey showing that 77% of adults over 50 want to age in place.
The built environment makes this aspiration survivable or not. Fall injuries are the leading cause of injury-related death among adults over 65, and the Centers for Disease Control estimated in 2021 that 3 million older adults were treated in emergency departments for fall injuries.
Age-friendly city frameworks, formalized through the AARP Network of Age-Friendly States and Communities and the WHO Global Network for Age-Friendly Cities and Communities, have been adopted by over 400 jurisdictions in 22 U.S. states. The framework covers transportation, outdoor spaces, housing, civic participation, and social inclusion.
Cities that have implemented structured age-friendly built environment improvements, such as New York City, which began its program in 2007, have documented measurable reductions in elder isolation, hospitalization rates, and fall-related injury claims. New York’s program was associated with a 7% reduction in emergency room visits by elders in participating neighborhoods between 2007 and 2015.
Cycling Infrastructure Is Not Gentrification’s Pet Project

Protected bike lanes reduce cyclist fatalities by 75-90% compared to painted lanes on shared roadways. Bike lane installation across 12 major U.S. cities has resulted in low-income neighborhoods receiving new cycling infrastructure at one-third the rate of high-income neighborhoods, despite lower car ownership rates.
The neighborhoods where cycling infrastructure would do the most economic and safety work are the ones least likely to receive it, because planning processes prioritize areas with organized advocacy capacity, which correlates with income and education.
San Francisco’s Tenderloin neighborhood, one of the city’s densest, poorest, and most dangerous for cyclists, went without a protected bike lane until 2021, while the adjacent SoMa and Mission districts, which began gentrifying in the mid-2000s, received extensive protected cycling networks starting in 2014.
Participatory Design Is Not a Community Meeting

The federal requirement for community input in urban planning, codified through NEPA and HUD regulations, has produced a ritual mistaken for participation: a notice on a utility pole, a Tuesday evening meeting in a room that seats 40, a PowerPoint already decided.
Authentic participation requires decision-making power, not advisory roles. Urban planner Sherry Arnstein mapped this distinction in her 1969 paper, A Ladder of Citizen Participation, separating genuine partnership and citizen control from the tokenism that most planning processes actually deliver.
Porto Alegre, Brazil, put the distinction into practice in 1989, giving residents direct control over municipal budget allocations. Giving communities control over flower planter placements while planners decide land use is not participation. It is permission to decorate someone else’s decision.
Homeless-Hostile Architecture Is Not Urban Design

Anti-homeless spikes, Camden benches, 3 a.m. sprinkler systems, slanted grates above warm air vents, and hostile architecture cost American cities. It moves homeless populations. It does not reduce homelessness. Visible homelessness is pushed from commercial corridors into residential neighborhoods or outer-ring areas where services don’t reach, a phenomenon researchers call spatial displacement without resolution.
The moral posture embedded in these design choices is specific: that public space exists to facilitate commerce and the comfort of housed populations, and that those without shelter have forfeited their claim to it. A 2019 New York Times investigation documented how anti-homeless infrastructure installed on 42nd Street during the 1990s Times Square renovation coincided with an increase in downtown displacement arrests.
Houston ran the opposite experiment. Between 2011 and 2022, the city reduced its homeless population by 63% through a Housing First model that provides permanent housing without preconditions, converting unused commercial space into transitional housing designed to integrate architecturally with surrounding neighborhoods.
The Cities That Have Done This Well Prove It Is a Choice

Vienna ranked as the world’s most livable city on the EIU’s 2023 Global Liveability Index. The Wiener Wohnen program caps rent at nearly 30% of income regardless of market conditions, mixes income levels without means-testing, and commissions architecture that doesn’t signal poverty. Middle-class families and low-income households share the same buildings.
Singapore houses 80% of its population in public estates and maintains racial integration across them through a Racial Integration Policy capping each ethnic group’s proportion per block. Coercive by any American political standard, but the outcomes are documented. Singapore has achieved residential racial integration that American cities, despite the Fair Housing Act of 1968, have not. Partly authoritarian governance. Mostly a political choice about whether the built environment should reflect inequality or dismantle it.
Medellín was the world’s most violent city in 1991. By 2015, that figure had significantly reduced. The reduction tracks directly to targeted infrastructure investment in the city’s most marginalized hillside comunas. Not solving poverty. Dissolving the isolation that allows violence to concentrate.
Key Takeaways

- Exclusionary zoning, redlined transit routes, and inaccessible sidewalks are not failures of planning. They are its documented outcomes, compounding across generations along racial and income lines.
- Disabled Americans, non-English speakers, low-income renters, the elderly, and neurodivergent individuals are underrepresented in planning processes structurally, not incidentally, and the built environment reflects that absence.
- Neighborhoods with the lowest car ownership have the fewest bike lanes. Neighborhoods with the highest chronic disease burden receive the least park acreage.
- Vienna, Singapore, Medellín, and Porto Alegre have each demonstrated that intentional design policy produces measurable outcomes: in life expectancy, homicide rates, residential integration, and budget allocation. America has access to all of it and has largely declined to apply it.
- Community input processes mandated by federal law have produced meetings, not decisions. Until low-income communities hold actual authority over land-use choices, not flower planter placements, inclusive urban design remains an aspiration managed by the people least affected by its absence.
Disclaimer – This list is solely the author’s opinion based on research and publicly available information. It is not intended to be professional advice.
Like our content? Be sure to follow us