
Groceries take less income than before. Here are 12 reasons it still feels brutal at checkout
The disconnect starts with a paradox Americans hear constantly: groceries are supposedly more affordable now than at almost any point in modern history, yet food insecurity still affected roughly 47 million people in the United States in 2023. If food is taking a smaller share of income than it did decades ago, why are millions still skipping meals, rationing portions, or carrying grocery debt into the next month?
Affordability statistics tend to flatten reality into a single reassuring trendline. They compare percentages across decades, average incomes across wildly unequal households, and prices across regions that barely resemble one another economically. But grocery shopping is not lived statistically. It is lived weekly, sometimes daily, through repeated encounters with higher totals, smaller packages, fewer choices, and the persistent feeling that every routine item suddenly demands negotiation.
What makes modern grocery stress difficult to explain is that several things can be true simultaneously. Food can consume a smaller share of national income than it once did while still becoming harder to afford for millions of families. Wages can rise while purchasing power shrinks under the pressure of housing, debt, and transportation costs. Official inflation can cool while the practical cost of feeding a household continues to climb due to hidden fees, shrinkflation, and interest charges.
The number is real, but most people don’t live on average

Americans spend roughly 11% of their disposable income on food today, a steep drop from the 17% recorded in 1960. That stat gets cited often, usually with a tone that implies people should feel better.
They don’t, and the reason is structural: that 11% average is dragged down heavily by the top income quintile, households earning $150,000 and above, who spend a far smaller share on food simply because their denominator is enormous. For the bottom 20% of earners, food commands closer to 36% of their after-tax income.
Averages, when weighted by a deeply unequal income distribution, stop describing most people’s reality and start describing the comfortable minority’s. A metric built to reassure can also quietly obscure. The 11% figure is accurate; it’s just that accuracy and relevance aren’t always the same thing.
Prices dropped in relative terms, then surged back in absolute ones

Between 2020 and 2023, U.S. grocery prices rose 25% to 30%, the fastest three-year climb since the early 1970s. The relative share of income spent on food may be lower than in 1960, but that historical framing evaporates at the register where you’re paying with today’s dollars, not historical percentages.
A carton of eggs that cost $1.47 in 2019 hit $4.82 in early 2023, a 228% price increase, driven by a combination of avian flu outbreaks, supply chain disruption, and producer consolidation that kept prices elevated long after cost pressures eased. Beef prices climbed 21% in 2021 alone.
The human brain doesn’t calculate food affordability as a percentage of income at checkout; it compares last month’s receipt to this month’s, and that comparison has been brutal, repeatedly and memorably, since 2020.
Shrinkflation doesn’t show up in official price indexes

Shrinkflation: manufacturers reducing product volume rather than raising the sticker price, leaving inflation indexes blind to the actual cost-per-unit increase consumers absorb.
Edgar Dworsky, founder of Consumer World, has tracked hundreds of such reductions since 2020, documenting products across categories such as coffee, toilet paper, juice, and crackers, where unit prices rose 15–30% without any change in the listed shelf price. The Consumer Price Index measures price changes on a per-package basis by default, meaning a 10% volume reduction that maintains the price register at zero inflation.
Consumers, buying by habit and not by microgram, pay more per use without any visible price signal. The affordability statistics simply don’t capture this, which means the official record of food costs is systematically understated.
Wages rose, but not evenly

Between 2021 and 2023, U.S. median compensation grew from approximately $58,130 in 2021 to over $63,900 in 2023, a figure frequently cited to argue that workers came out ahead of food inflation.
For some, that’s true. For the 73 million Americans earning below $15 per hour as of 2022, disproportionately concentrated in food service, retail, and caregiving, real wage gains, adjusted for broad inflation, were essentially flat or slightly negative during the same period, according to Economic Policy Institute analysis.
The wage growth story also glosses over geography: a 10% nominal raise in a city where rent consumed 50% of pre-raise income leaves less discretionary room for grocery inflation, not more. Food costs don’t adjust for local housing burden.
The worker in Austin or Miami who got a $2 raise and faced a $400 rent increase didn’t come out of 2022 with more purchasing power at the grocery store; they came out with less, regardless of what the aggregate wage chart shows.
Fewer competitors, less pressure to keep prices down

Four firms, Walmart, Kroger, Costco, and Amazon, now control roughly 65% of U.S. grocery sales. That level of market concentration, achieved largely between 2000 and 2020 through acquisition and scale advantages, reduces the competitive friction that historically kept prices in check.
A 2023 Federal Trade Commission report explicitly flagged grocery consolidation as a contributor to sustained post-pandemic price elevation, noting that retailers with dominant regional market share maintained elevated margins even as their wholesale input costs normalized.
The proposed Kroger-Albertsons merger, which would have combined the country’s two largest traditional supermarket chains, faced FTC opposition, specifically on the grounds that it would reduce price competition for millions of shoppers with no realistic alternative.
That merger was blocked in late 2024, but the broader consolidation it represented didn’t reverse; it just stopped accelerating. A market with fewer players isn’t one that self-corrects toward the consumer.
The official averages describe a country that most people don’t shop in

Around 19 million Americans live in food deserts, low-income census tracts where the nearest supermarket is more than a mile away, a distance that becomes a logistical and economic barrier without reliable transportation, per USDA definition and mapping data.
In these areas, the default grocery option is often a convenience store or dollar store, where food prices per unit are 20–40% higher than at a full-service supermarket, and the nutritional variety is substantially narrower.
The national average grocery price statistic pools together the Whole Foods shopper in Bethesda and the dollar store shopper in rural Mississippi, two people experiencing food costs so structurally different that a single average obscures both experiences.
Urban food deserts are disproportionately concentrated in Black and Latino neighborhoods, a spatial inequality documented extensively by researchers, including Mari Gallagher in her 2006 landmark study, still referenced in urban planning literature.
Millions are paying interest on lettuce
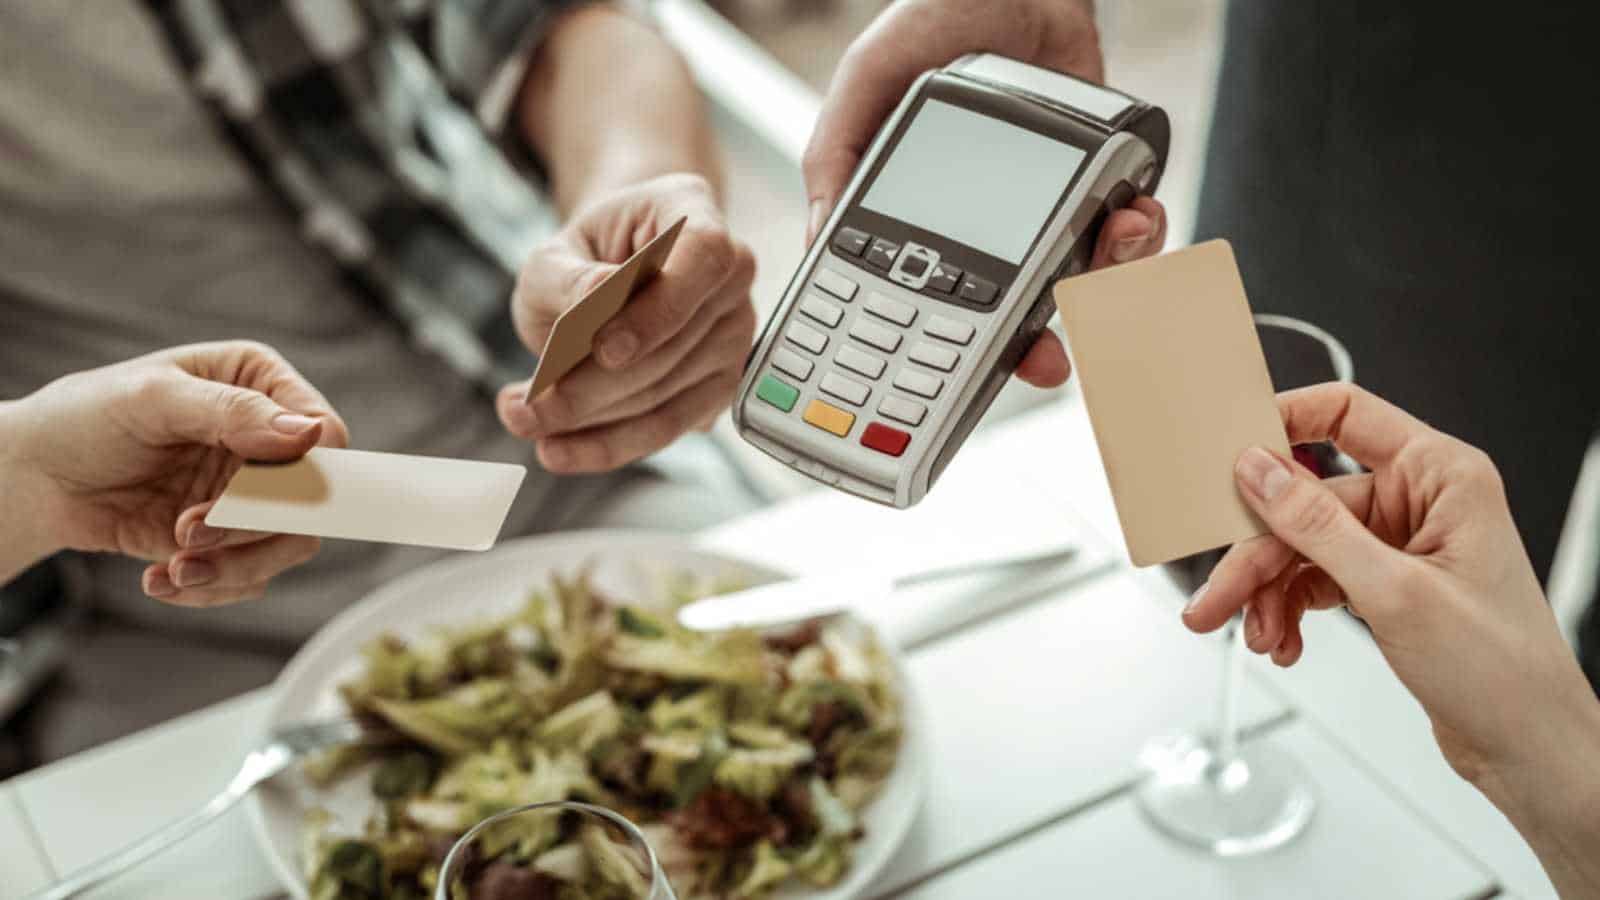
In 2023, more Americans relied on credit to cover food costs as grocery inflation persisted. An Urban Institute analysis found that 20% of adults who carried grocery purchases on credit cards did not pay those balances in full, and LendingTree surveys showed rising use of BNPL services for groceries.
At an average credit card interest rate of 24.37%, the highest in 40 years as of late 2023, a $200 grocery run that rolls over for three months costs closer to $236 by the time interest clears. The psychological and financial burden of knowing that today’s food bill will still be accruing interest in February is a distinct, undercounted dimension of how people experience grocery costs.
Debt creates a lag between the purchase and the full price you feel at checkout and again at the end of every billing cycle. Academic work by Harvard economist Raj Chetty and colleagues has documented that low-income households spend a larger fraction of income on necessities purchased on credit, meaning interest effectively functions as a regressive tax on basic consumption. Food may be taking up a smaller share of income, but that calculation typically doesn’t include the financing costs.
Price memory is ruthless where food is concerned

Humans are disproportionately good at remembering the prices of items they repeatedly buy. Behavioral economists call this reference price anchoring: the cognitive mechanism by which past prices serve as benchmarks for evaluating current ones.
Grocery shopping is among the highest-frequency purchase behaviors in most households, meaning the reference price memory is constantly refreshed, tested, and violated. When a jar of pasta sauce climbs from $3.49 to $4.99, the brain doesn’t perform an income-share calculation; it registers a 43% jump from the number it has stored.
Losses loom larger than equivalent gains, meaning price increases feel roughly twice as painful as equivalent price decreases feel relieving. The emotional math of grocery shopping is therefore structurally weighted toward pain, regardless of whether the macroeconomic picture has improved.
Hidden costs inflate the real price beyond what the sticker shows

The listed price of a grocery item is increasingly a floor rather than a ceiling. Grocery delivery platforms typically charge a 10% to 20% markup on listed item prices, in addition to delivery fees and service charges. For households without cars, elderly shoppers, or people in areas where walking to a store is impractical, delivery is the only way to access a store.
Those households pay a significant premium for the same nutrition that a car-owning suburban shopper gets at sticker price. Packaging costs, often invisible to consumers, rose as resin and cardboard prices spiked, and many manufacturers passed those costs through incrementally rather than in headline price changes.
Fuel surcharges embedded in distributor contracts added further layers. None of these costs appear separately on a grocery receipt, and none are cleanly isolated in standard inflation metrics, yet every one of them raised the actual cost of feeding a household.
The inputs all inflated simultaneously

The standard argument for why grocery costs are manageable leans on the comparison between cooking at home and eating out. Home-cooked meals remain dramatically cheaper per calorie than restaurant food. That’s true, but the gap narrowed significantly between 2021 and 2023 as home energy costs surged alongside food prices.
Residential natural gas prices rose 26% in 2022 alone, per U.S. Energy Information Administration data, and electricity costs climbed 14.3%, both hitting households who cook at home directly and in ways that don’t appear in food price indexes. The cost of running an oven, refrigerating perishables, and washing dishes in hot water is a real, recurring component of home food production that the grocery price statistic doesn’t capture.
Add appliance replacement, a figure that has risen with supply-chain-driven appliance price increases, and the full infrastructure cost of cooking at home is considerably higher than the receipt total implies. Food prices and food costs are not the same figure.
Food waste means you pay more per meal than your receipt suggests

The average American household throws away 31.9% of the food it purchases. At a median household grocery spending of roughly $5,700 annually, that’s approximately $1,800 in food purchased and discarded, which inflates the effective per-meal cost by nearly half.
A household that spends $100 on groceries and eats 70% of what it buys is really spending $143 per usable unit of food. Food waste is not equally distributed: lower-income households waste proportionally less, a finding consistent across multiple studies, likely because the margin for waste is smaller when every purchase is felt.
Higher-income households waste more, and their waste subsidizes the appearance of food abundance in aggregate consumption statistics. Reducing household food waste to 20% would represent a larger, real reduction in food costs for most families than any price drop the grocery industry is likely to deliver, making it one of the few affordability levers actually within individual control.
The benchmark is 1960, and 1960 wasn’t neutral

The data point that anchors the entire argument that Americans spent 17% of their income on food in 1960 versus roughly 11% today deserves interrogation of its baseline. In 1960, women’s labor force participation was 38%; by 2023, it had reached 57%.
A significant portion of the 1960 food budget was offset by unpaid domestic labor, primarily women’s time spent sourcing, preparing, preserving, and storing food at home. The shift to two-income households, which drove real income growth and reduced the food-share percentage, also eliminated the labor subsidy that made home cooking cheap.
Convenience foods, which most families now rely on to manage time-scarce cooking schedules, cost more per calorie than raw ingredients, the price of time essentially baked into the product. The improvement in food affordability between 1960 and now is partly real and partly a statistical artifact of comparing incompatible economic arrangements. One built on unpaid household labor, the other on purchasing the convenience that labor once provided.
Key Takeaways:

- Americans spend a smaller percentage of income on groceries than in past decades, but that national average hides how heavily food costs still burden lower-income households.
- Grocery pain is driven less by one single factor and more by overlapping pressures, including inflation, shrinkflation, housing costs, debt, delivery markups, and regional inequality.
- Official affordability metrics often miss consumers’ real experience because they fail to fully capture reduced package sizes, financing costs, food deserts, and the rising infrastructure costs of cooking at home.
- Market consolidation among major grocery chains has weakened competitive pressure, allowing elevated prices and margins to persist even after some supply-chain pressures eased.
- Food affordability today is shaped as much by time, geography, and access as by sticker prices, making modern grocery stress a structural issue rather than simply a matter of consumer perception.
Disclaimer – This list is solely the author’s opinion based on research and publicly available information. It is not intended to be professional advice.
Like our content? Be sure to follow us