
12 reasons Americans aren’t feeling the economic growth
The U.S. economy grew in 2025. Unemployment stayed relatively low. The stock market posted one of its better years. On paper, most of the indicators that economists use to declare a healthy economy were pointing in the right direction.
And yet, three-quarters of Americans rated economic conditions as only fair or poor, according to the Pew Research Center. Consumer sentiment barely budged from levels recorded during the worst inflation spike in four decades. Grocery bills kept climbing. Rent stayed out of reach.
Medical debt accumulated quietly in households that had insurance. The distance between what the data says and what people feel is not a perception problem. It is a distribution problem, and these are the twelve reasons it exists.
GDP doesn’t pay rent, or anything else, really

Numbers on a government spreadsheet rarely translate into the feeling of financial breathing room. The U.S. economy grew 2.2% in 2025, according to the Bureau of Economic Analysis, slightly slower than the 2.4% recorded in 2024. Economists graded the year somewhere in the B range. However, the public frequently grades it lower (C-F) due to the everyday financial strain of high prices and living costs.
GDP, as a measurement tool, captures total output, not who captures the output. A billionaire tripling his net worth and a nurse rationing insulin both register in the same aggregate figure. Economist Simon Kuznets, who helped develop GDP as a wartime metric in 1934, warned Congress that the welfare of a nation can scarcely be inferred from a measurement of national income.
What GDP also doesn’t capture: unpaid care work, environmental degradation, the psychological tax of economic precarity, or the gap between what a job pays and what a city costs.
Wages at the median went down in real terms in 2025, depending on which inflation measure you use, but down nonetheless. Average monthly job creation collapsed from nearly 122,000 per month in 2024 to 15,000 per month in 2025, per the Center for American Progress. Growth on paper. Stillness in the pocket.
The wealth gap just hit a 36-year record, and it’s widening

The top 1% of U.S. households own 31.7% of all national wealth, the highest share recorded since the Fed began tracking household wealth in 1989.
That 1% collectively held roughly $55 trillion in assets, nearly equal to the combined value of everything owned by the bottom 90 percent of Americans. Meanwhile, the bottom 50% of households held just 2.5% of national wealth, down from 3.4% in 1989.
The engine driving this divide is stock ownership. The richest 1% controls 50% of all U.S. stocks and mutual funds, up from 40% in 2002. During 2025, the S&P 500 climbed nearly 18%, easily beating its historical average annual return. Households earning $100,000 or more hold stocks at a rate of 87%. Among households earning under $50,000, that rate falls to 28%. So, when Wall Street booms, the gains flow almost entirely to those who already have.
Credit card debt crossed a trillion dollars, and nobody thinks it’s stopping

Americans carried more than $1 trillion in credit card debt by the end of 2025, while interest rates on many cards remained above 20%. More households are relying on credit cards for groceries, rent, utility bills, and emergency expenses rather than discretionary spending.
About 47% of cardholders carry balances month to month, per Bankrate’s 2025 debt report, reflecting how common revolving debt has become across income levels. Financial counselors note that housing, transportation, and insurance costs have risen faster than many workers’ paychecks, leaving less room for savings or unexpected expenses.
Delinquency rates also increased in 2025, especially among younger borrowers and households with tighter budgets. Economists often point out that debt levels alone do not tell the full story; many families still make payments consistently and use credit strategically. But the broader concern is how little flexibility remains when costs rise suddenly.
Credit cards increasingly function as short-term survival tools rather than convenience products. That shift helps explain why conversations around debt now resonate far beyond traditionally low-income households, reaching people who previously considered themselves financially stable.
Grocery prices didn’t get the memo about slowing inflation

The price of beef jumped 16% between January and December 2025. Coffee rose nearly 20%. Fruits and seafood each climbed more than 6 percent compared to pre-tariff trends, per the Center for American Progress. The price of a standard supermarket cart rose by an average of 5% from December 2024 to December 2025. When the Yale Budget Lab ran the numbers, the tariff structure in 2025 translated into an additional $1,700 annually for the average household.
The Consumer Price Index dropped from 2.7% in late 2025 to 2.4% in January 2026, technically cooling. But the categories Americans feel most acutely, food and healthcare, both accelerated. Food-at-home inflation rose from 1.7% in 2024 to 2.3% in 2025, per Equitable Growth analysis.
Grocery costs became the top anxiety for American consumers. Nearly two-thirds of Americans have already switched to cheaper groceries or bought less food altogether. What decelerating inflation actually means is that prices are still rising, just slightly more slowly than before.
Healthcare costs are driving Americans into debt, even with insurance

Millions of Americans borrowed money in 2024 to cover healthcare expenses, including many who already had insurance. Rising deductibles, specialist fees, prescription costs, and uncovered treatments continue to strain household budgets.
Surveys from the Kaiser Family Foundation show that many insured adults still worry about out-of-pocket costs, while a significant share report delaying or adjusting medical treatment due to affordability concerns. For some families, even routine care can become financially disruptive when combined with rent, childcare, or existing debt obligations.
Outstanding medical debt in the United States remains widespread, with government-linked analyses estimating totals in the hundreds of billions of dollars. Researchers and healthcare economists frequently note that medical debt affects middle-income households as well as lower-income communities, especially after serious illness or prolonged treatment.
Policy changes tied to insurance subsidies and premium support may also increase monthly healthcare costs for some marketplace enrollees in 2026. While insurance continues to protect many families from catastrophic financial collapse, coverage alone no longer guarantees predictability.
Housing has become a trap most Americans are locked out of

Owning a home consumed 47.7% of the median household’s income as of mid-2025. For context, 30% has long been considered the threshold for financial manageability. That 47.7% has hovered between 40% and 50% for two straight years, not a momentary spike, a new structural reality. Home prices nationally are up 60% since 2019 and still climbing at 3.9% year over year as of early 2025, per the Joint Center for Housing Studies. Since 2019, the income required to purchase a single-family home has doubled.
Home sales have fallen to their lowest level in 30 years. The National Association of Realtors reports the median age of a first-time homebuyer hit 40 in 2025, a record high, up from 33 just five years prior. Among Black renters, just 7% can afford the median-priced home. Among Hispanic renters, 11%.
Institutional investors now account for a record 30% of single-family home purchases, compressing the inventory available to individual buyers. Among the 22.6 million cost-burdened renter households in 2023, those earning under $30,000 per year had just $250 per month left after housing and utilities to cover everything else. A tank of gas and a few groceries.
Student debt is reshaping how many Americans plan adulthood

Student loan balances in the United States remained at historically high levels through 2025, with tens of millions of borrowers carrying federal student debt. Repayment pressures intensified after pandemic-era pauses ended, and missed payments rose noticeably across several borrower groups.
Student debt often influences decisions about housing, transportation, entrepreneurship, and long-term savings. Many borrowers describe loans less as a temporary obligation and more as a recurring monthly expense that shapes nearly every major financial milestone.
Economists continue to debate the long-term value of higher-education debt because outcomes vary widely by degree type, institution, and career path. Some borrowers experience substantial income growth tied to their education, while others struggle to translate degrees into financial mobility.
The repayment burdens can persist far longer than borrowers originally expected, particularly for older Americans still carrying balances decades after leaving school. The broader concern is not simply the size of the debt itself, but how repayment obligations influence economic confidence and life planning across multiple generations.
The job market’s recovery story skips many workers feeling financially exposed

Headline employment numbers in 2025 painted a mixed picture. Job growth continued, but at a slower pace than the previous year, while hiring weakened across several industries. Consumer confidence surveys also showed that many Americans remained uneasy about their financial future despite relatively stable unemployment levels.
A healthy-looking market on paper does not always translate into stability for workers navigating rising living costs, contract work, or uncertainty about future layoffs.
That uncertainty affects groups differently. Hourly workers and households without significant savings tend to feel economic slowdowns more quickly because they have less of a financial cushion when schedules shrink or expenses increase. Analysts studying workforce trends also point to automation and AI-related anxieties as part of the broader mood surrounding employment.
Even workers who remain employed may still feel financially vulnerable if raises fail to keep pace with housing, healthcare, or transportation costs. The result is a labor market where employment exists, but confidence remains fragile. For many households, economic security depends not only on having a job but on believing that the job will remain reliable enough to plan around.
Two-thirds of Americans are living paycheck to paycheck

Nearly two-thirds of U.S. households now spend most of their income on essentials, leaving little cushion for anything else. The Bank of America Institute, drawing on internal data on tens of millions of customers, sharpened that figure: 24% of households spend over 95% of their income on necessities alone: housing, gas, groceries, childcare, utilities. What remains after that does not cover emergencies, retirement contributions, or a single unexpected bill, without resorting to a credit card.
The compression has been building for years. Consumer prices rose between August 2020 and August 2025, while wages for most workers failed to close that gap in any meaningful way. Financial fragility is no longer concentrated at the bottom of the income ladder: high earners are reporting little to no savings buffer, driven by lifestyle inflation and mounting fixed costs.
30% of women have no emergency savings at all, compared to 17% of men, and for those without a cushion, the next unexpected bill doesn’t trigger a withdrawal. It triggers debt at a 20% interest rate. The buffer is gone, and what replaced it costs more than most people realize until they receive the statement.
The K-shaped economy means growth shows up in stock portfolios, not grocery bags
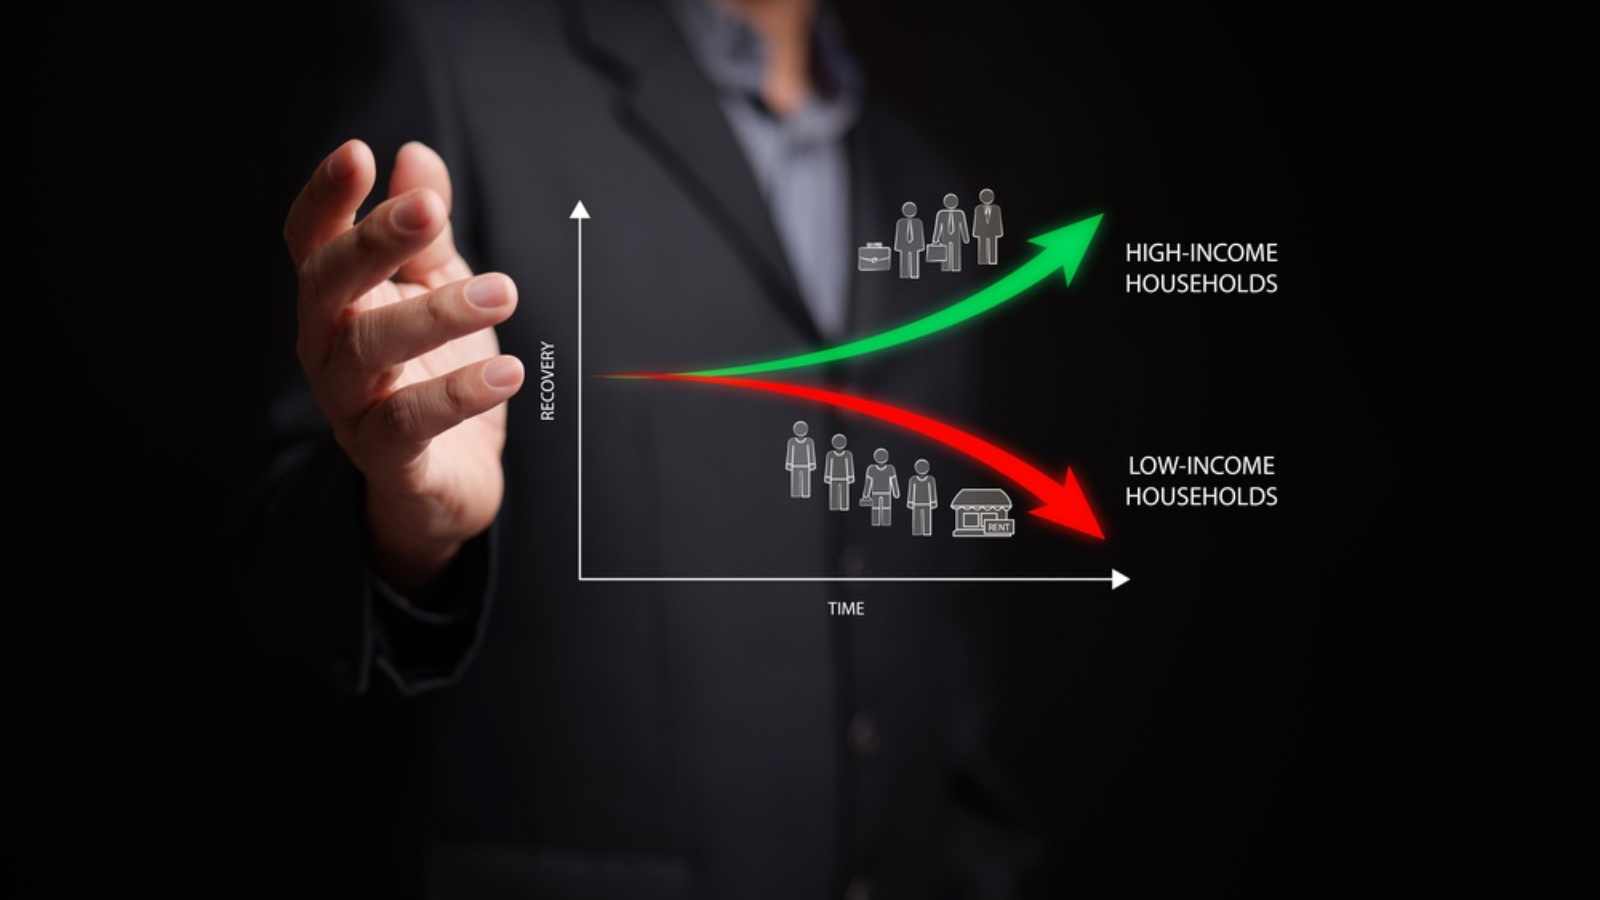
Oxford Economics chief U.S. economist Michael Pearce called 2025 another year of resilience, then immediately qualified it as not spectacular. That framing makes more sense when you identify which variable is growing the most. The S&P 500 gained nearly 18% in 2025. Consumer spending in the July-September quarter grew 3.5%.
Mastercard’s Christmas spending data showed purchases up 3.9% year over year. Read those numbers without context, and the economy looks fine. Read them alongside who is actually driving the spending, and a different picture emerges.
Economic activity is increasingly dependent on a narrowing slice of the population, a structurally fragile architecture that healthy GDP numbers do nothing to address. For everyone below that threshold, the spending figures reflect not growing purchasing power but credit cards and savings accounts quietly running dry.
Tariffs are a tax that mostly hits the people who can least afford it
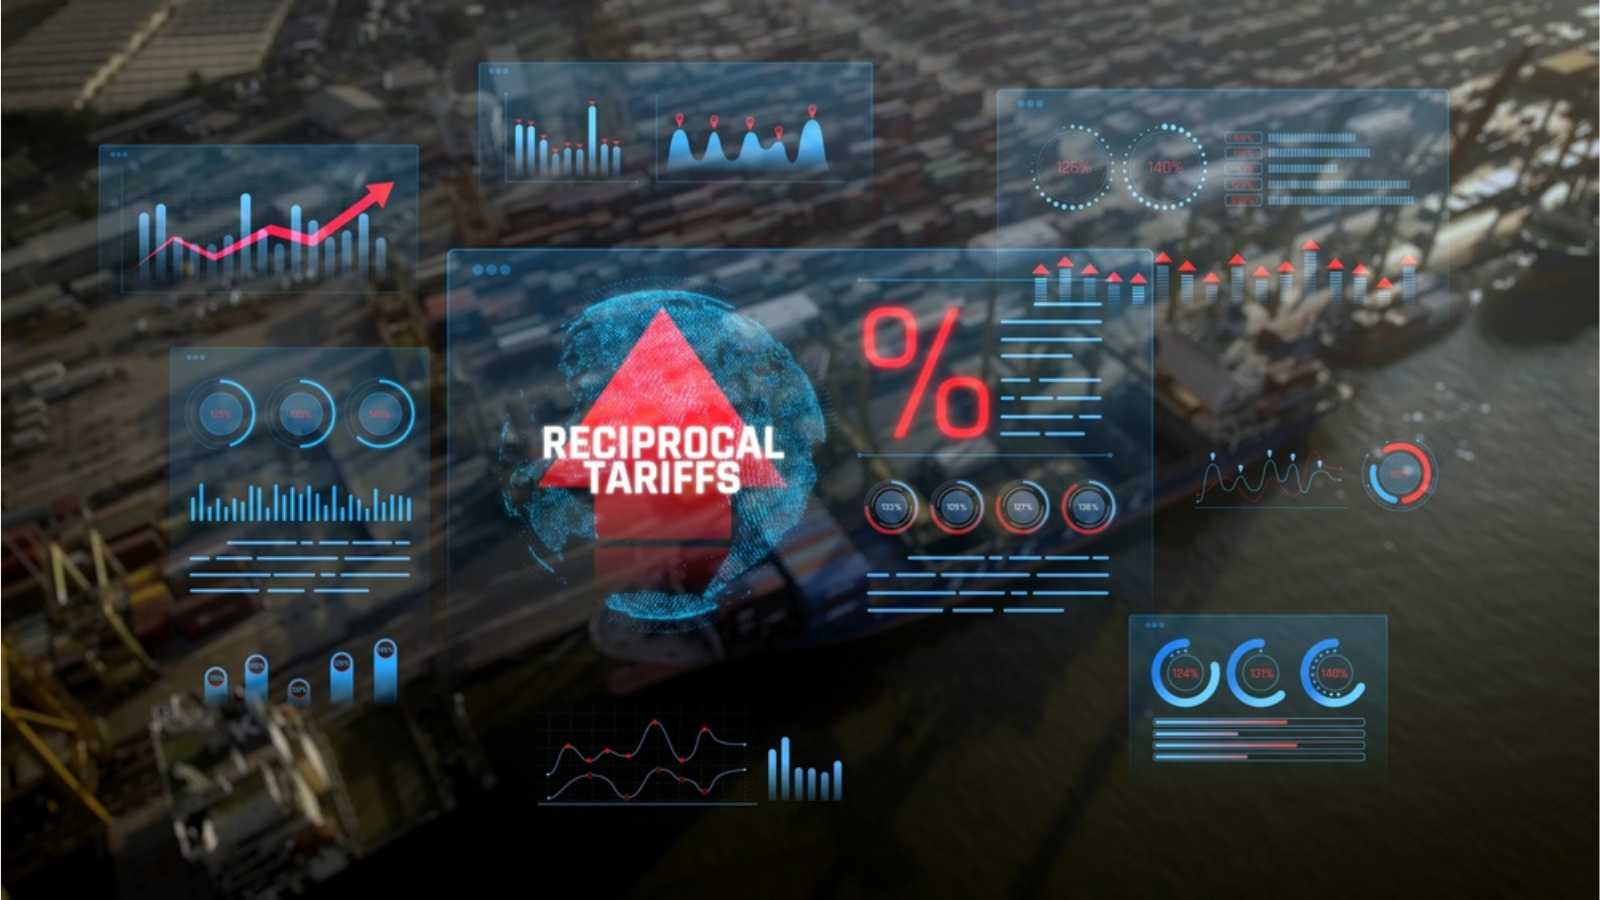
The argument offered to the public was that tariffs protect American manufacturing and generate federal revenue without raising income taxes. What they function as, in practice, is a consumption tax, and consumption taxes are structurally regressive.
Lower-income households spend a higher proportion of their income on physical goods and essentials, so when prices on those goods rise, the bite is proportionally larger than it is for wealthier households, who can absorb it.
Following the 2025 tariff rollout, household essentials moved sharply: nondurable goods like cleaning supplies and toilet paper rose, household furnishings climbed, and clothing surged.
By December 2025, two-thirds of Americans expressed concern about the personal financial impact of tariffs. And according to the Century Foundation survey, about half of the Americans reporting difficulty affording food come from working-class households that backed Trump in large numbers in 2024. The burden landed squarely on the population that was told it was the primary target of the benefit.
Sentiment is a signal, and it’s been flashing red for years

Economists have long debated whether consumer sentiment is a cause or consequence of economic conditions. The answer, evidently, is both. A Conference Board report in late 2025 found confidence declining for the fifth consecutive month.
The University of Michigan’s sentiment index hit 50 in June 2022, at the peak of a widely acknowledged inflation crisis, and had recovered only to 53.3 by December 2025. For all the growth the headline numbers recorded in between, sentiment barely moved. More than half of American adults believe the economy was getting worse, the highest share since July 2022 and the highest ever recorded under a Trump presidency.
Sentiment tracks what GDP ignores: anticipation, trust, and the subjective weight of stagnation. Demand is there, people are willing to spend, but they’re doing it with the quiet fear that AI displacement or mass layoffs are just close enough to justify not feeling secure. The spending is real, but it is coming from habit, from credit, and from a buffer that is visibly thinning. The vibes are not detached from reality. They are reading a reality that aggregate numbers are structurally designed to miss.
Key Takeaway

Economic growth is a real thing. So is the experience of not feeling it. When the top 1 percent holds more national wealth than the bottom 90 percent combined, when three-quarters of Americans can’t afford a median-priced home, when medical debt accumulates in households with insurance, and when credit card debt climbs past a trillion dollars, the problem is not that people are misreading the economy.
The problem is that the economy is being read through metrics designed for a different question. GDP measures output. It does not measure whose output it is, where it goes, or whether it arrives at the kitchen table.
Until that measurement gap is taken as seriously as the growth number itself, the distance between the data and the experience will keep widening, and so will the frustration of the people living in it.
Disclaimer – This list is solely the author’s opinion based on research and publicly available information. It is not intended to be professional advice.
Like our content? Be sure to follow us